
Current eMessage > Rockin’ Reports > July 2021
Rockin’ Reports
Revenue review with Web Reporting Marketing reports
by Rick Paulsen, Client Relations Manager
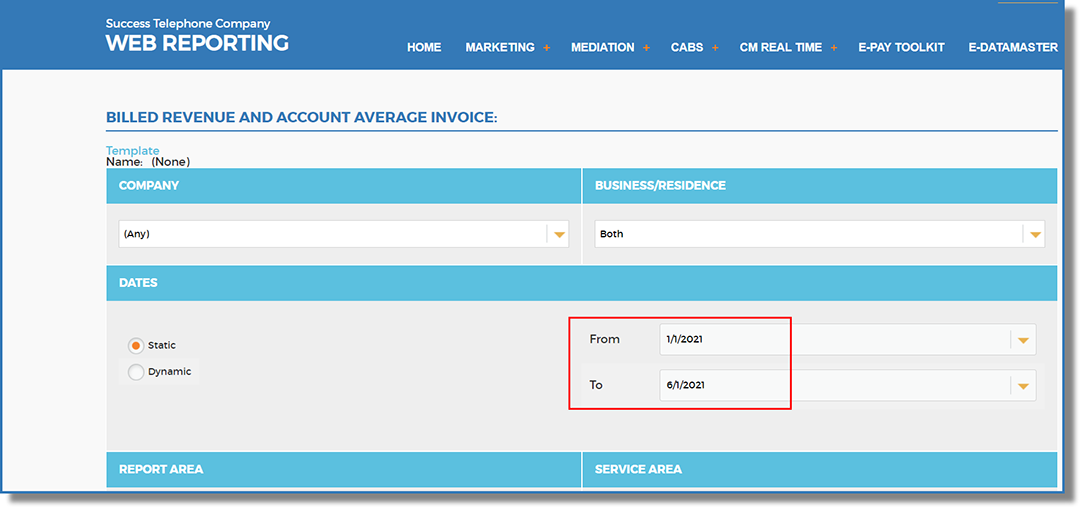
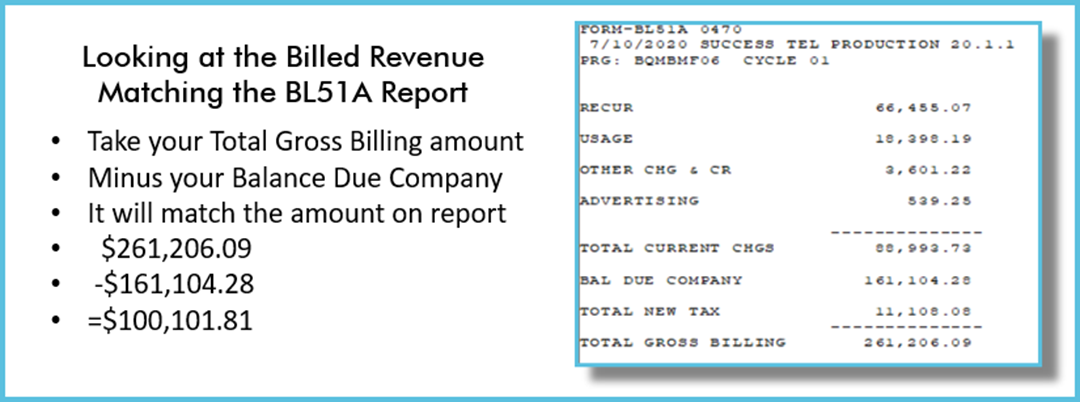
Using the marketing reports found in our Web Reporting tool is an efficient way to view overall trends and details in your company’s revenue stream. To get started, the Billed Revenue and Account Average Invoice report shows the revenue at both the company and account levels.
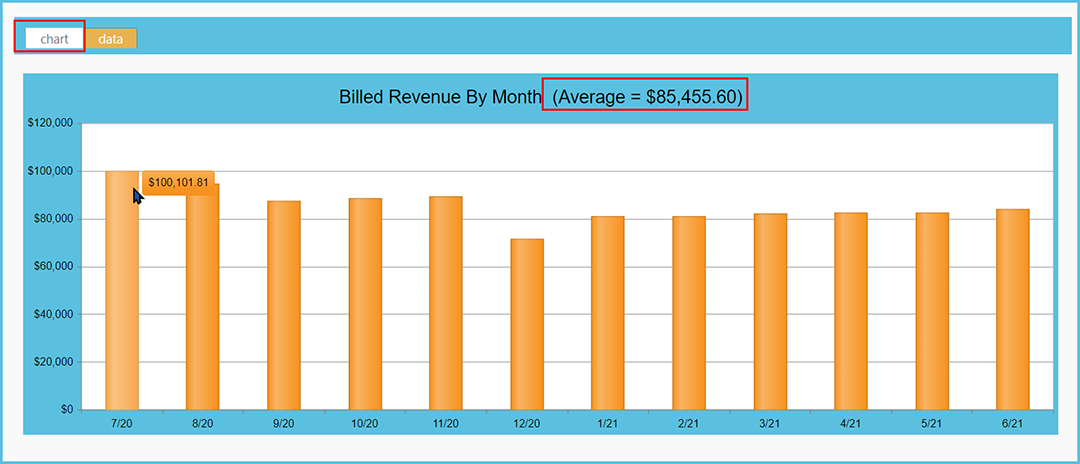
You can create a report for one month’s data or multiple months’ worth of data. I like to pick 12 months’ worth of data to get an annual snapshot. Below we see the graph displaying 12 months and the monthly average for those months. If you place your cursor on a particular month, you can see its revenue.
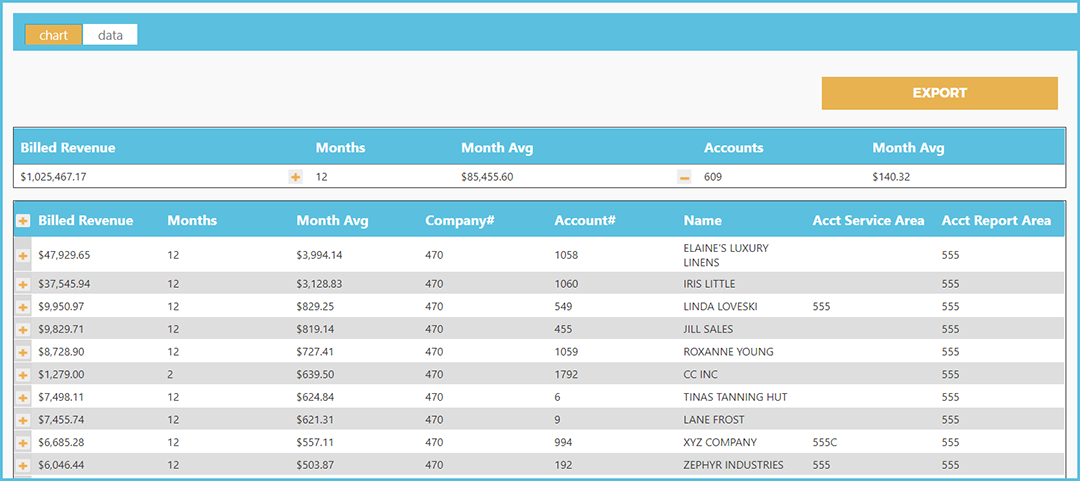
You can look at this information in the Data selection instead of a Graph where you’ll see the total billed for the timeframe selected. In this instance we are looking at 12 months. You’ll see the per month average for the number of months selected. Additionally, the total number of billed Accounts during that timeframe is available along with the monthly average of customers’ bills.
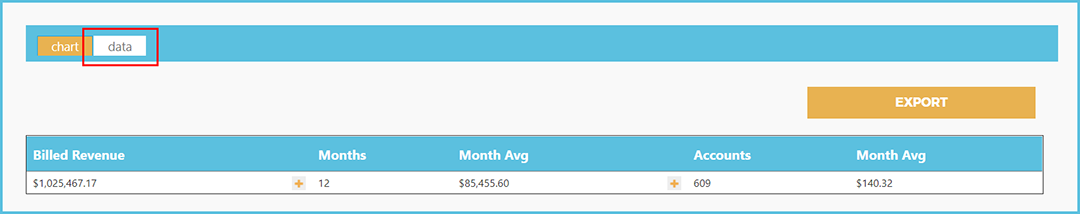
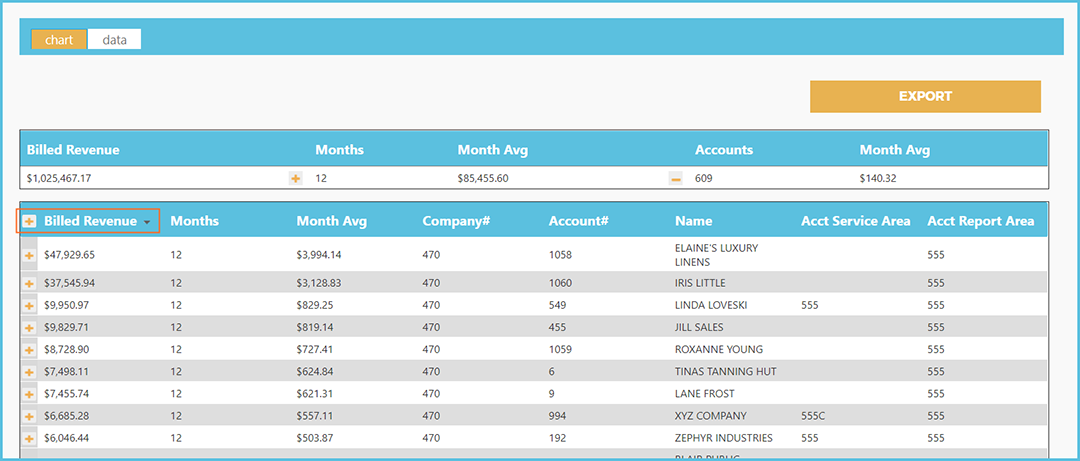
As shown below, you can see where I highlighted the + indicators showing where you can drill down to see additional data.
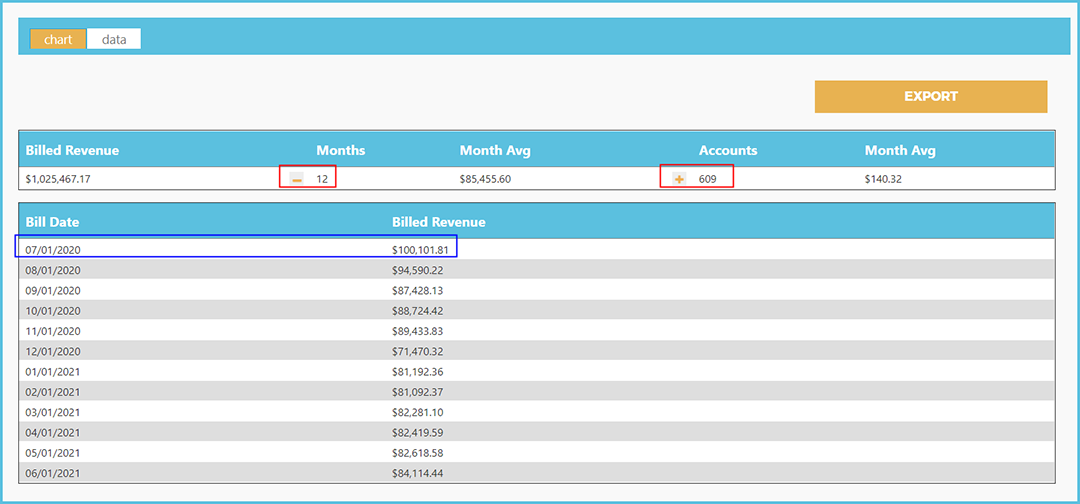
Now I have clicked on the Plus sign next to Accounts. This action opens the data up for review. It also gives you the timeframe you are searching on, or it shows the number of months this customer has been active if they haven’t been a customer for a full year. As you can see it is sorting by the monthly average amount. If I were to click on the Billed Revenue heading it will sort on that basis as shown below as well.
If you click on the “+” if front of each account it will open and show you each month’s revenue.
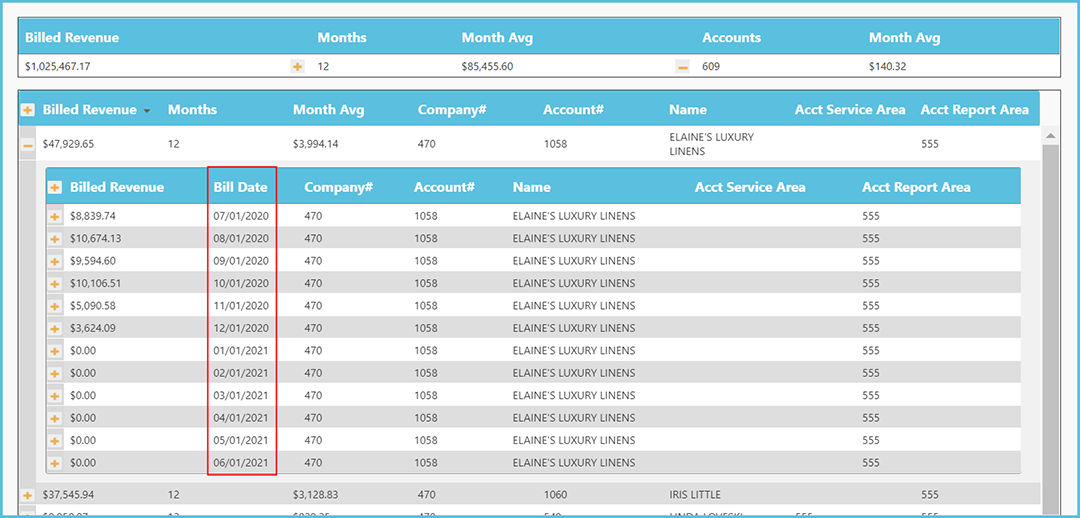
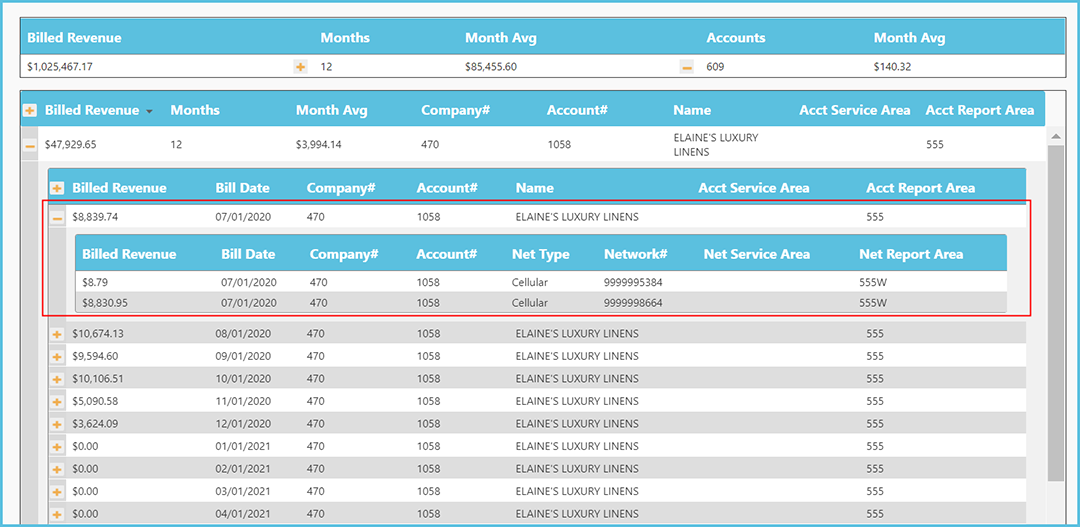
If I click on the “+” in front of a particular month for an Account, it will show what was billed for the billing month of 07/01/2020, the amounts, and networks. It will also show you the Network Report Area as illustrated below.
These reports are all exportable to Excel and give you top to bottom results in revenues. Plus they let you know who your top revenue generators are…it’s a quick and easy way to see your top ten customers. You also have many filter options to use, such as Business and Residential, Report Area, and Service Area.
Overall, it’s a great report to review as you can keep an eye on certain accounts if needed. This is just one of many reports available in MACC’s Web Reporting service. If you currently don’t have Web Reporting and Toll Viewing, and would like information on this robust reporting tool, contact your Client Relations Manager or your Account Manager. Thank You!
Return to current eMessageArticle Archive
October 2020
Stay on top of delinquent accounts
May 2020
Stay on top of delinquent accounts
February 2020
USP code clean-up
January 2020
BL22C tracks revenue by report area
November 2019
Billing Attribute Report Options
October 2019
BL50O1: 6 Month Trending Report
.